4.1.7 Volume tables
In addition to frequencies and percentages, the tabulate-command can also be used to generate volume tables. Instead of frequencies or frequency percentages, each cell will show summary statistics as specified for an optional variable. The following option will produce volume tables in combination with the tabulate-command:
summarize(<variable>)
By default, means are shown. However, this can be altered by using the following extra options in the tabulate-expression:
-
mean: Mean value (default) -
sum: Sum -
std: Standard deviation -
p25: 25%-quartile -
p50: 50%-quartile (= median value) -
p75: 75%-quartile -
gini: Gini coefficient value -
iqr: Interquartile value (range between 75th and 25th percentile)
Note that you can display several statistics in each cell, e.g. mean and median. You can also display statistics for several variables in each cell, e.g. average annual salary and gross assets. Examples of this are shown below.
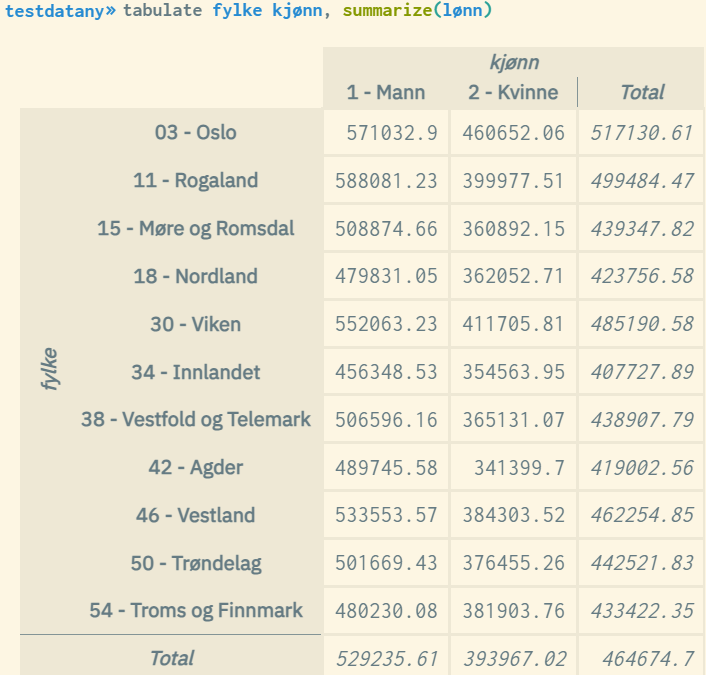
Example showing standard value (average) for annual salary divided by county and gender:

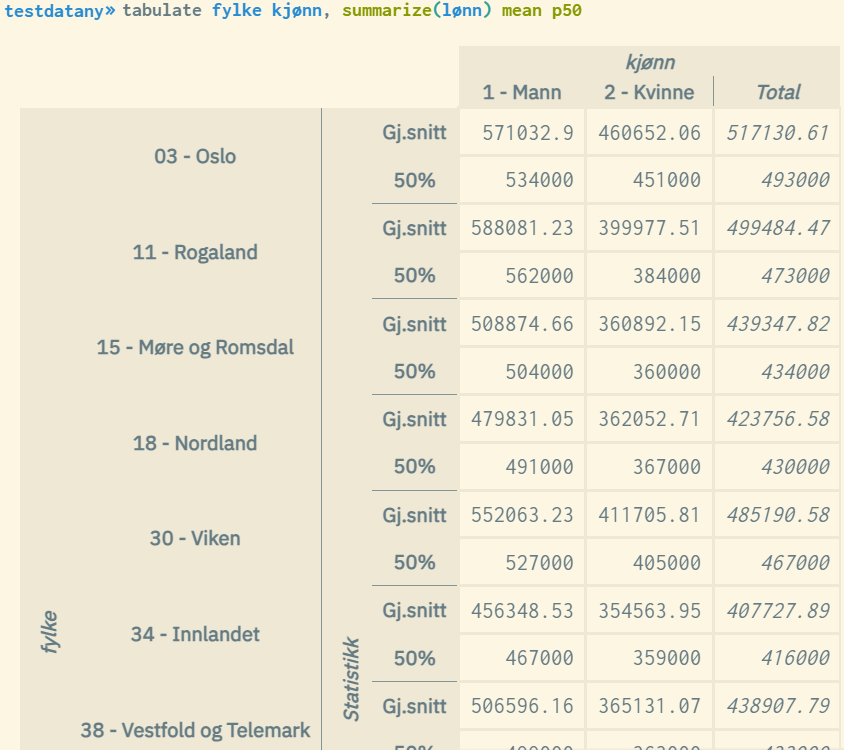
Example showing average and median value:

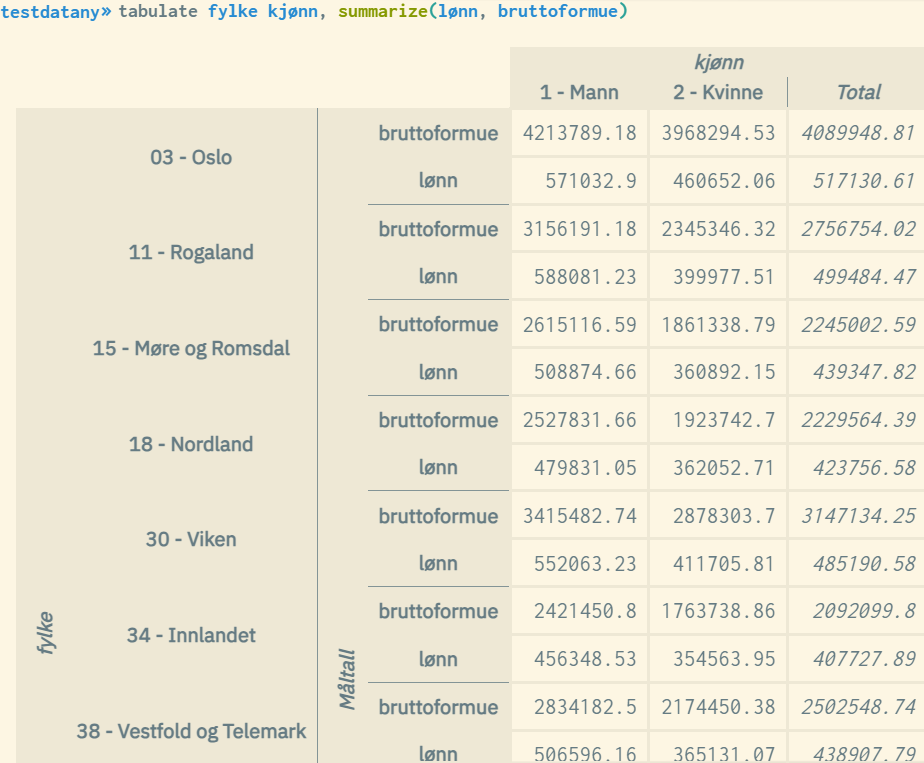
Example where average is shown for annual salary and gross assets, divided by the same variables:
